Decoding Brain Connections: Exploring Neural Function Networks Through fMRI Graph Analysis
Dear readers, we will travel to the world of computational medical imaging. I owe you to enjoy the trip, an exciting journey will be! Tighten your belts, we are diving in a special adventure where you will learn how to unveil the neural connections using fMRI graph analysis.
And here is our trip’s plan:
Introduction
1- Graph Theory in Brain Network Analysis
2- Mapping Brain Activity with fMRI
3- Constructing Brain Networks from fMRI
4- Key Insights from Graph Metrics
5- Applications in Neuroscience
Conclusion
Introduction
Brain connections/networks are collections of widespread brain regions showing functional connectivity by statistical analysis of the functional Magnetic Resonance Imaging (fMRI) or other recording methods.
An emerging paradigm in neuroscience is that cognitive tasks are performed not by individual brain regions working in isolation but by networks consisting of several discrete brain regions that are said to be “functionally connected”.
The brain is an exceptionally complex system and understanding its functional organization is the goal of modern neuroscience. Using fMRI, significant progress in understanding this organization have been made by modeling the brain as a graph. To create these graphs, nodes are defined as brain regions of interest and edges are defined as the functional connectivity between them.
Many new concepts! Don’t feel overwhelmed. We’ll go over them in depth. You may be like me in thirst to learn about the brain so here is it to make that frontal lobe in work !
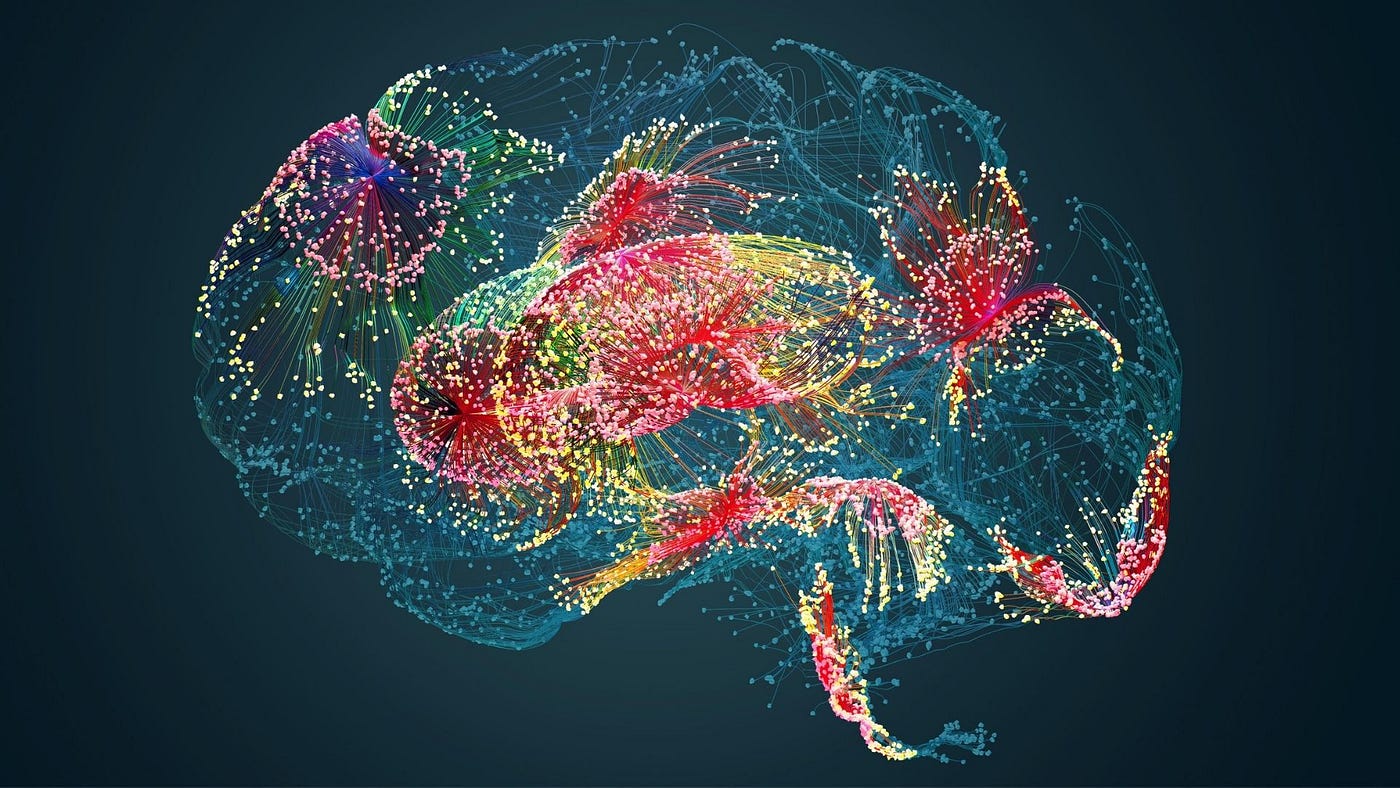
This image is an overview of what we can do with brain connections decoding.

You may wonder “What a long introduction!”. Yes it is and for reason, I want you to be well positioned in the topic so that you fathom both the main idea and the new concepts.
Let’s get back on track! Starting with:
1- Graph Theory in Brain Network Analysis
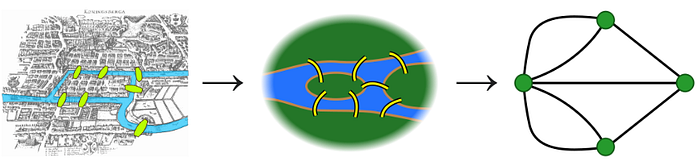
The first application of graph theory and network analysis can be traced back to 1736 when Leonhard Euler solved the Königsberg Bridge Problem. The problem was to devise a walk through the city that would cross each of those bridges once and only once (We should name it challenge don’t you think!).

A graph consists of a finite number of nodes, also known as vertices, connected by links known as edges. Graph theory has had a significant impact on a variety of real-world issues in other fields, including transportation systems, social networks, big data environments, the internet of things, electrical power infrastructures, and biological neural networks.

Here is the transformation of Königsberg Bridge Problem into a Graph:
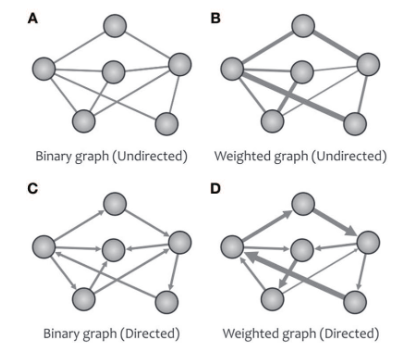
A graph may be classified as either directed or undirected based on whether the links between vertices carry directional information (causal interaction). Also as either weighted or unweighted (binary) where edges have values associated with them representing distances, costs, or any other meaningful measure. Weights are equal for binary graphs.
The brain’s intricate web of connections between regions can be effectively represented as a graph, with nodes representing brain regions and edges representing functional connections between them.
2- Mapping Brain Activity with fMRI
In this section, I invite you to listen to the fMRI Brain scan sounds (Keep the volume down. That is loud!).
So what is happening ?
Each beep you will hear is a picture of a slice through the brain that the machine is taking , and what is special about fMRI is that the brightness of each part of that image tells us how much neural activity is going on in that part of the brain. So what is that brightness? The basic idea is that neurons are like muscles so if a part of the brain turns on and the neurons start firing there, you need to send more blood to supply those neurons because it’s metabolically expensive just like running with a muscle and so what happens when more blood is sent to that part of the brain is that the amount of oxygenated hemoglobin in there changes. So each bang is a little radio frequency magnetic pulse that has been sent, it is like pinging in a wineglass, it reorients the hydrogen atoms in the brain and the speed at which they return to their original state provides a measure of the level of oxygenated hemoglobin in that specific brain area hence the brightness. The brain is a 3-D object and pictures of it are taken (for example) by making a series of horizontal slices and within each slice there is a 2D picture of what is going on there.
fMRI: Advantages & Disadvantages
Advantages:
- The best spatial resolution available for studies on normal subjects.
- Noninvasive (as we don’t have to be with an open skull to see what in there).
Disadvantages:
- Researchers do not fully understand every aspect of the process as in the scan they can only look at the blood flow, not at individual neuron’s activities.
- Expensive ( >$600/hour!)
- Loud banging noise (yeah that loudly!)
3- Constructing Brain Networks from fMRI
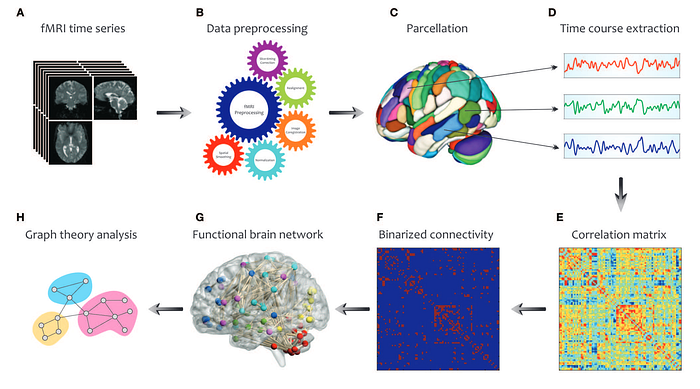
First, we will process the raw fMRI data. Second we will divide the brain into different parcels, think of this technique as an automated anatomical labeling atlas being applied to divide the entire brain into several cortical and subcortical anatomical units (underneath the cortical surface). According to that, several time courses are extracted from each region referring to blood oxygen levels.
Third, for all pairs of brain regions, we calculate the correlation coefficients to create a correlation matrix which will be binarized through thresholding (explained in the next paragraph) to focus on the most meaningful connections.
Finally, the corresponding functional brain network are constructed. Eventually, graph analysis is performed on the brain’s connectivity network by quantifying a set of topological measures known as graph metrics.
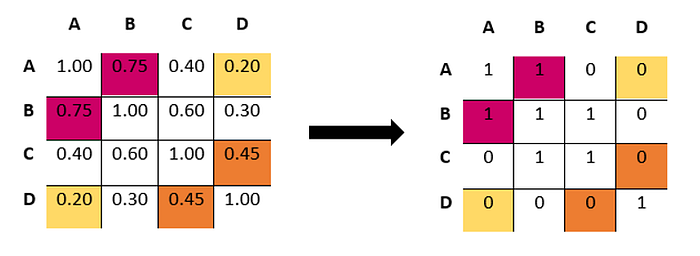
Thresholding technique consists on giving 1 to to all values that are bigger than the chosen threshold otherwise 0. Here, I’ll give you an example to ensure your comprehension (try to do it by your own hiding the result on the right).
4- Key Insights from Graph Metrics
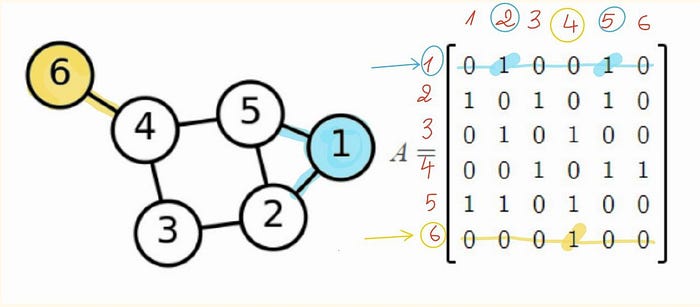
To start I will present for you the adjacency matrix as it is a key component for graph metrics.
In graph theory, an N×N adjacency matrix (also called a connection matrix) with the elements of zero or non-zero indicates the absence or presence of a relationship between the nodes of a network with N nodes. By extracting different metrics from this matrix, one can obtain a topological analysis of the desired graph.
Please actively “read the image” below, it shows you how to transform a graph having 6 nodes to an adjacency matrix, by placing the nodes on it as presented in red then for each connection we put 1 otherwise 0 (for binary graph). In particular, node ‘6’ is only connected to node ‘4’ so that in both (as it is an undirected graph) row number 6 and column number 6 , values are zeros except values facing node ‘4’.
The most commonly used graph metrics for characterizing the functional brain network are described in two main groups: global and local properties.
- Local properties: Centralities belonging to this category are focused on the information of node itself and the information of its surrounding neighbouring nodes for example: Node Degrees, Maximal clique centrality (MCC) and Maximum neighbourhood component (MNC).
- Global properties: Global-based algorithms rank nodes according to the efficiency of global information communication, considering the nodes’ position on the information diffusion path such as Betweenness centrality, Closeness centrality and Bottleneck.
5- Applications in Neuroscience
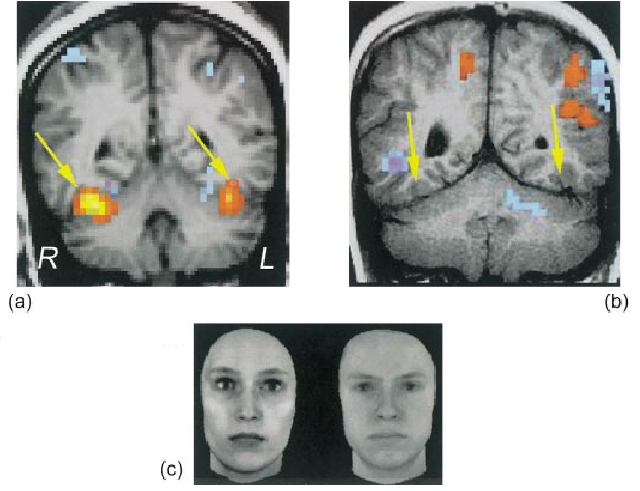
Brain function networks have shown important applications in brain disease analyses. Many studies have shown that most neurological and psychiatric disorders have such disconnection between nodes, such as the neurodegenerative diseases (Alzheimer’s disease, Parkinson’s disease, mild cognitive impairment, etc.) and the mental disorders (depression, anxiety, schizophrenia, etc.).
Brain function network has become an important content of disease brain function network research. All kinds of nervous system disorders will lead to changes in the topological structure of brain functional networks.
In particular, a study found that with the deterioration of Parkinson, the connection between brain regions will gradually break. Researchers demonstrated that the brain network analysis can identify Parkinson’s disease and depression.
Conclusion
The advancement of fMRI technology allows us to explore the functional connections of the human brain from a network perspective. Many key topological aspects hidden in the structure and function networks of human brains are revealed by complex network theory.
These topological structures will show varying degrees of abnormality in brain diseases. As a result, fMRI-based brain function network research can not only give a new viewpoint for understanding the pathological mechanisms of neuropsychiatric deseases, but also approaches for disease early detection and therapy evaluation.
Always remember: Don’t believe everything you think.
References
Grelotti, D.J., Gauthier, I. and Schultz, R.T. (2002), Social interest and the development of cortical face specialization: What autism teaches us about face processing. Dev. Psychobiol., 40: 213–225. doi: 10.1002/dev.10028
Farahani FV, Karwowski W and Lighthall NR (2019), Application of Graph Theory for Identifying Connectivity Patterns in Human Brain Networks: A Systematic Review. Front. Neurosci. 13:585. doi: 10.3389/fnins.2019.00585
Wang, Z., Xin, J., Wang, Z. et al. (2021), Brain functional network modeling and analysis based on fMRI: a systematic review. Cogn Neurodyn 15, 389–403 doi: 10.1007/s11571-020-09630-5
MIT OpenCourseWare. Lecture 5: Cognitive neuroscience methods II — 9.13 spring 2019: The human brain: Brain and cognitive sciences. https://ocw.mit.edu/courses/9-13-the-human-brain-spring-2019/resources/mit9_13s19_l05/
Wang, M., Wang, H., & Zheng, H. A Mini Review of Node Centrality Metrics in Biological Networks. International Journal of Network Dynamics and Intelligence. 2022, 1(1), 99–110. doi: 10.53941/ijndi0101009
ChatGPT helped me, essentially, to set the outline of the article